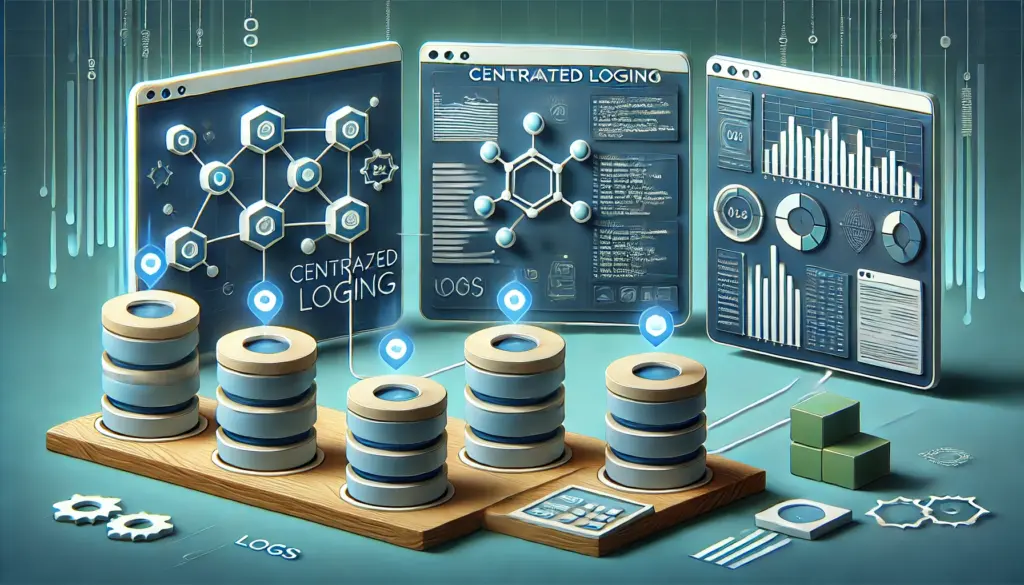
Efficient logging is the backbone of debugging and monitoring in any software system. Centralized logging takes this a step further by aggregating logs across multiple services and environments into a single, easily accessible platform. In this blog, we will dive into how GoLang developers can implement centralized logging to simplify debugging and enhance observability.
Learn more about logging best practices here.
Why Centralized Logging is Crucial for Debugging and Monitoring
In modern microservices architectures, applications often consist of several interconnected services. Each service generates logs, which are critical for:
- Debugging Issues: Quickly identifying and resolving problems.
- Monitoring Behavior: Understanding the flow of requests and system health.
- Enhancing Security: Detecting anomalies and potential breaches.
- Scaling Applications: Observing how applications perform under load.
- Regulatory Compliance: Ensuring logs are accessible for audits and meet industry standards.
Centralized logging collects all these logs in one place, making it easier to search, analyze, and draw insights. Without it, managing scattered logs becomes a nightmare.
Check out why centralized logging is essential for microservices.
Essential Logging Tools and Libraries in GoLang
Before diving into centralized logging, it’s essential to understand the logging libraries available in GoLang:
- Log Package: The built-in
logpackage is simple and easy to use for basic needs. - Zap: A high-performance structured logging library by Uber.
- Logrus: A popular logging library with advanced features like hooks and formatters.
- Glog: Google’s library focused on verbosity.
Most centralized logging systems support structured logs, so libraries like Zap and Logrus are excellent choices for compatibility.
Discover a guide to structured logging with Zap.
Step-by-Step Guide to Centralized Logging Setup in GoLang
Step 1: Choosing the Right Centralized Logging Platform
Some popular centralized logging platforms include:
- ELK Stack (Elasticsearch, Logstash, Kibana): Open-source and highly customizable.
- Graylog: Open-source with great scalability.
- Loggly, Datadog, Splunk: Managed solutions offering easy integration.
- Cloud-Native Solutions: Services like AWS CloudWatch and Google Cloud Logging for seamless cloud integration.
Explore the features of ELK Stack.
Step 2: Structuring Your Logs Effectively
Structured logs make it easier to query and analyze data. Use JSON format for compatibility:
import (
    "go.uber.org/zap"
)

func main() {
    logger, _ := zap.NewProduction()
    defer logger.Sync()

    logger.Info("User logged in",
        zap.String("username", "johndoe"),
        zap.String("status", "success"),
    )
}
Step 3: Setting Up Log Forwarding Agents
Use agents like Filebeat, Fluentd, or Vector to forward logs from your Go application to your centralized logging platform. For example:
- Configure your Go application to write logs to files.
- Set up a Filebeat agent to read log files and send them to Logstash or Elasticsearch.
Alternatively, some libraries like Zap can directly stream logs to cloud services or APIs for real-time processing.
Learn how to configure Filebeat.
Step 4: Adding Contextual Data to Logs for Better Insights
Contextual logging provides more insight into each log entry. Include trace IDs, user IDs, or request information:
func logWithTraceID(logger *zap.Logger, traceID string) {
    logger.Info("Request processed",
        zap.String("trace_id", traceID),
        zap.String("endpoint", "/api/v1/resource"),
    )
}
Adding contextual data like IP addresses, request headers, or timing information can further improve observability.
Step 5: Testing and Monitoring Your Centralized Logging System
Once logs are flowing to the centralized system, ensure they:
- Contain all necessary information.
- Are easily searchable and filterable.
- Provide actionable insights.
- Align with predefined logging standards or guidelines.
Discover tips for testing your logging setup.
Best Practices for Effective Centralized Logging in Microservices
- Use Log Levels: Categorize logs by severity (DEBUG, INFO, WARN, ERROR).
- Avoid Sensitive Data: Never log sensitive information like passwords or personal details.
- Enable Correlation: Use correlation IDs to track requests across services.
- Optimize Storage: Implement log rotation to avoid excessive storage costs.
- Leverage Alerts: Configure alerts for critical errors or unusual activity patterns.
- Standardize Formatting: Ensure all logs follow a uniform format for easier parsing.
- Include Metadata: Add metadata such as environment (prod, dev) or service name to logs.
Read more about log rotation strategies.
Advanced Features in Centralized Logging Platforms
Real-Time Log Analysis for Instant Issue Detection
Modern centralized logging platforms support real-time log analysis. This allows developers to detect issues as they occur and respond proactively.
Explore real-time logging with Splunk.
Machine Learning-Based Anomaly Detection in Logs
Some platforms, like Datadog or Splunk, use machine learning to identify anomalies in logs. These insights can uncover patterns or issues that might otherwise go unnoticed.
Integrating Distributed Tracing for End-to-End Observability
Centralized logging can be combined with distributed tracing tools like Jaeger or OpenTelemetry. Together, they provide a comprehensive view of how requests flow through microservices.
Learn more about OpenTelemetry.
Benefits of Using Centralized Logging in GoLang Applications
- Simplified Debugging Processes: Access logs from multiple services in one place.
- Enhanced Observability Across Services: Gain insights into system behavior and dependencies.
- Improved Performance Analysis: Detect bottlenecks and optimize code faster.
- Increased Security Measures: Identify and address potential vulnerabilities promptly.
- Scalable Log Management: Manage logs efficiently as your application grows.
- Regulatory Compliance Assurance: Ensure logs are stored and accessible per industry regulations.
Discover why observability matters.
Wrapping Up: Why Centralized Logging is a Must-Have for GoLang Developers
Centralized logging is a game-changer for maintaining robust and scalable systems. By leveraging tools like Zap for structured logging and integrating with platforms like ELK or Datadog, GoLang developers can enhance observability and streamline debugging processes.
Additionally, advanced features like real-time analysis and distributed tracing integration elevate centralized logging to a powerful tool for modern application development.
Ready to take your GoLang application to the next level? Start implementing centralized logging today! 🚀